Taking the measure of biodiversity change
by Flavio Affinito
Biodiversity is as an elusive concept; it covers many aspects of what we commonly refer to as “nature”. Put simply, biodiversity is the variety of life on Earth or in a particular location or ecosystem. But that variety expresses itself in many ways, from the many different species that make up the biosphere, to the various populations they form, communities they are part of and the genetic differences among individuals and populations. In fact, biodiversity can be measured and studied at many levels, from DNA to entire ecosystems and at each level can be measured in different ways. But first, we should ask why measure biodiversity?
Our planet is changing fast. Forests are being cut down (10 million hectares per year since 2015), oceans polluted (there are now 5.25 trillion macro and micro pieces of plastic in our ocean), and two-thirds of rivers are now impeded by dams and reservoirs worldwide. Ecologists have long noted the impacts human have on animals and plants, but the effects have accelerated over the last century. Today rates of extinction are 10-100 times the historical rate. We are confronted by the real prospect of entering a 6th mass extinction event entirely caused by us. Moreover, the rate at which species are disappearing today is higher than our ability to discover them, which means many plants and animals are going extinct before we even know they exist! When you consider that more than half of the world’s GDP is moderately or strongly dependent on healthy ecosystems this is particularly alarming. Society depends on nature for clean air, energy, water, food, medicine, and culture, so it is particularly alarming that we are placing this all at risk. If we are to avoid losing our life support system, it is imperative that we understand biodiversity change and eliminate the human-caused drivers of this change. That is why scientists, like us in the Gonzalez lab, are measuring biodiversity change and finding ways to reverse the trends.
Starting small

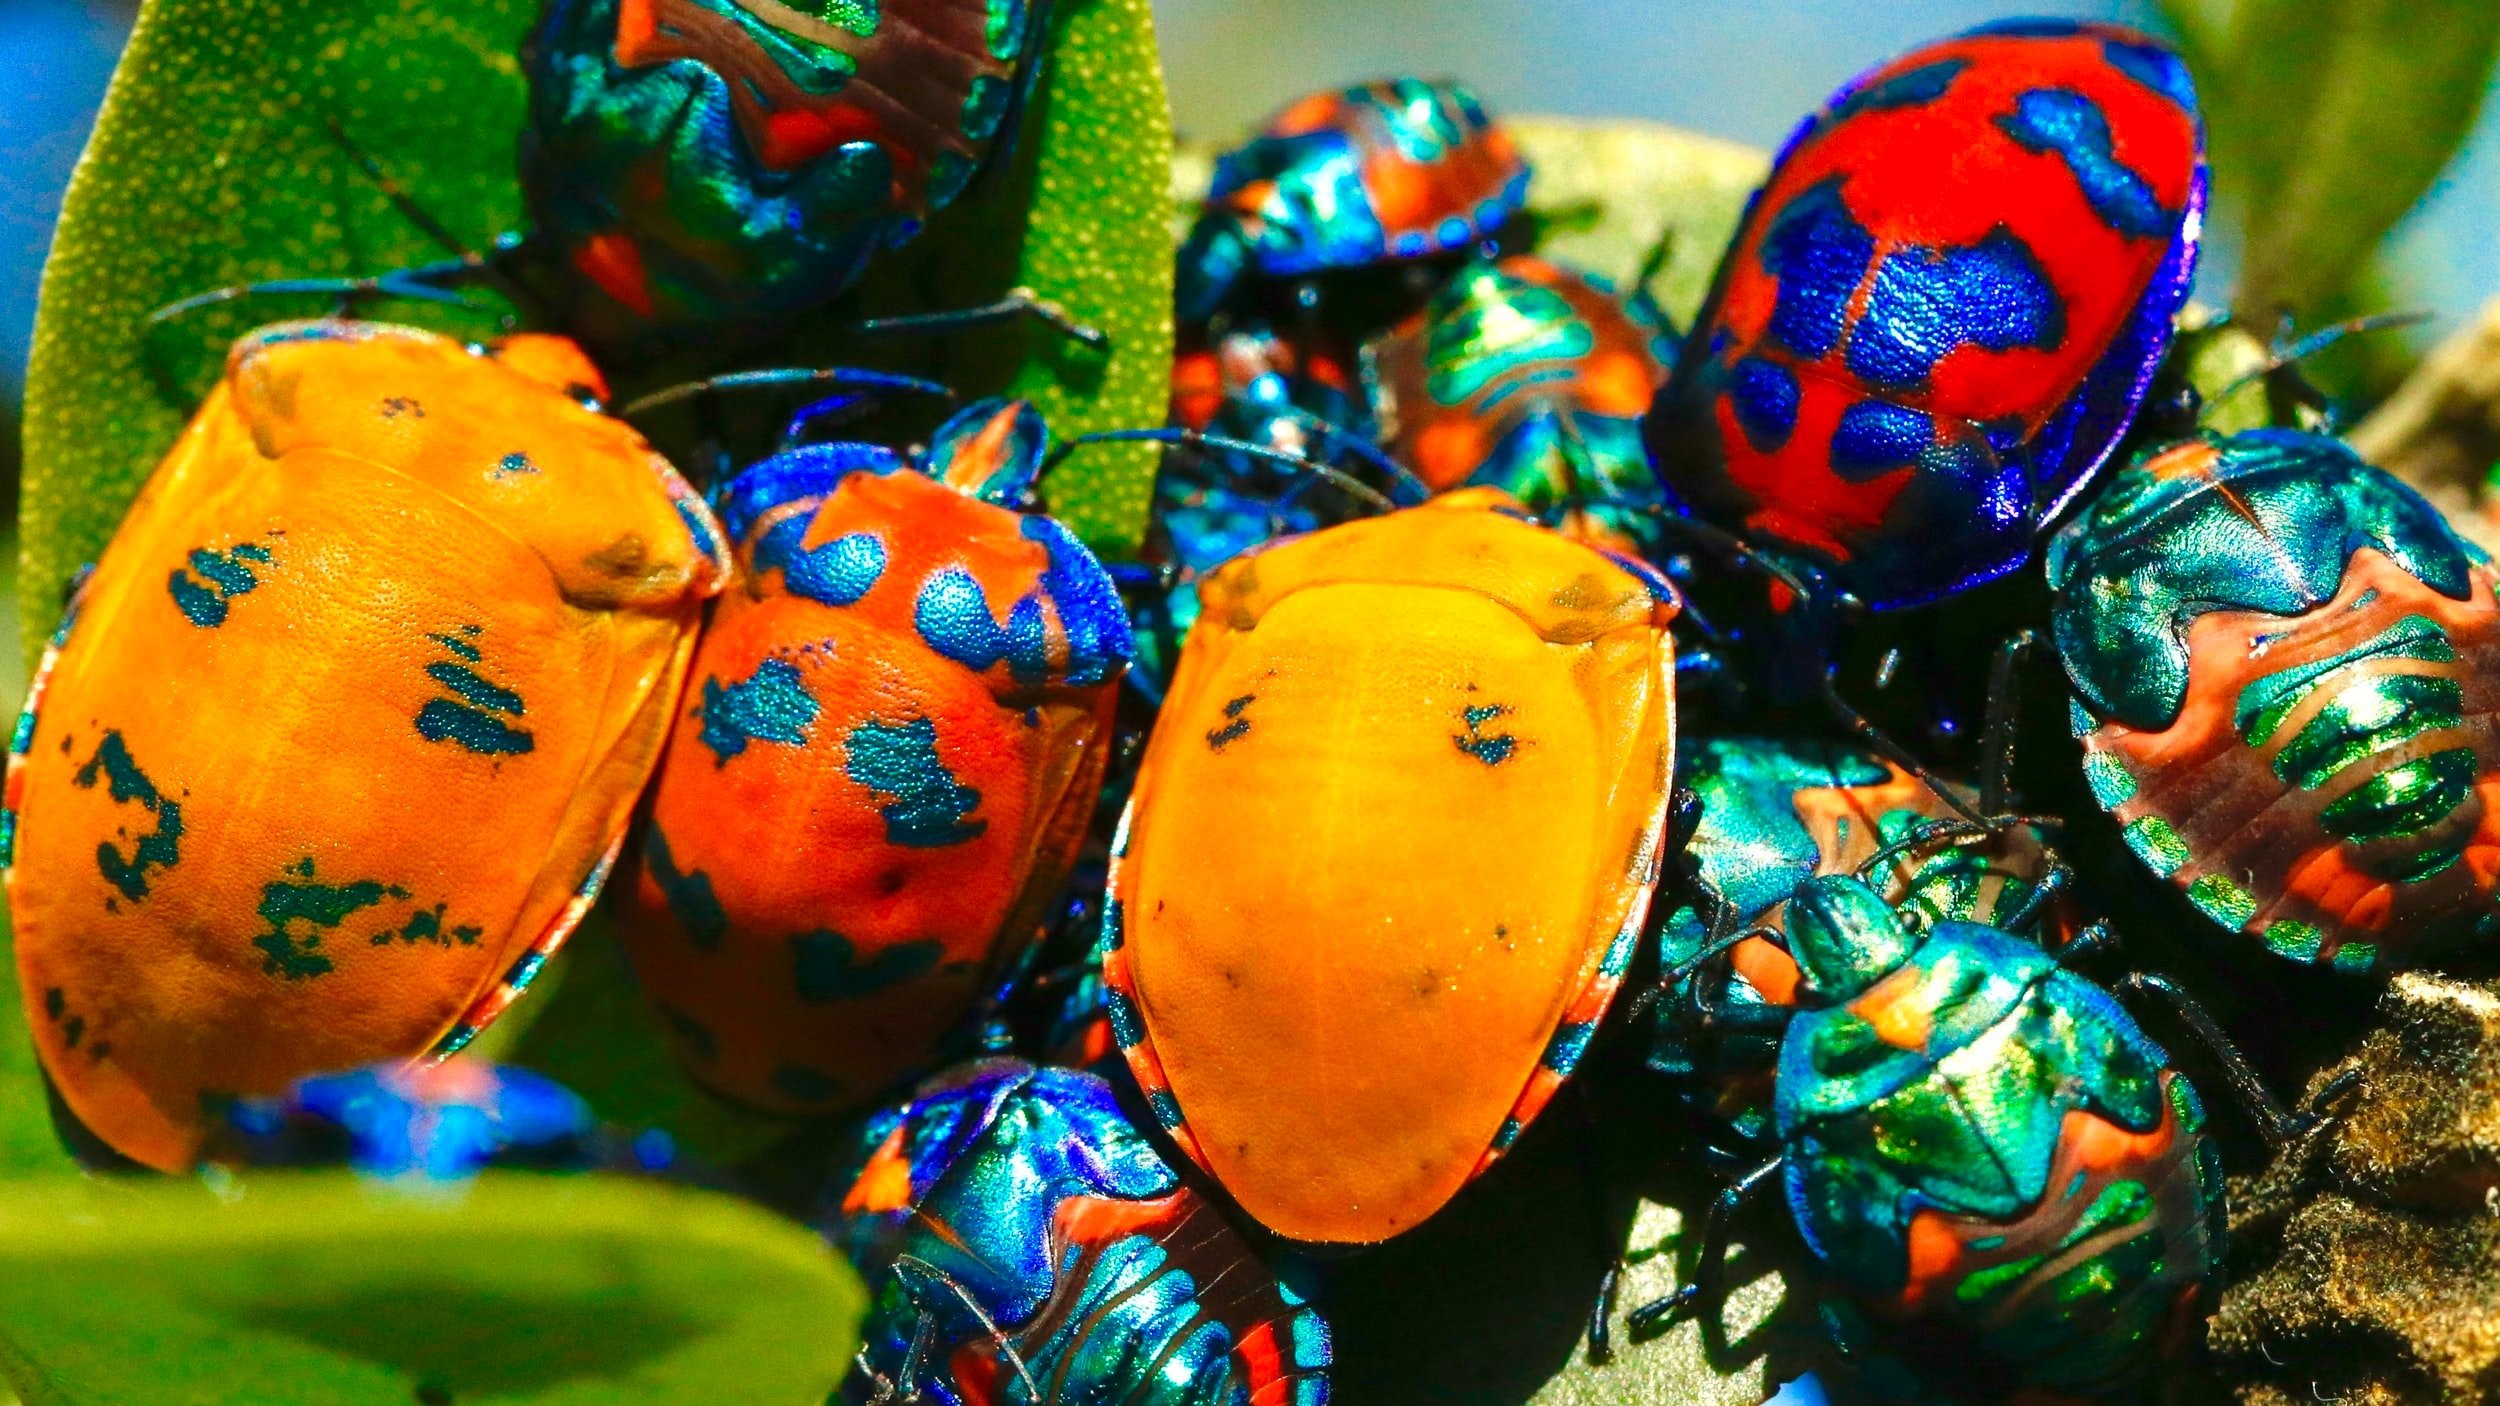
The diversity of beetle species and genes is truly staggering, evolutionary biologist J.B.S. Haldane once said that if a god or diving being had created all life on Earth then that creator must have had “an inordinate fondness for beetles”.
Biodiversity is changing all over the world, from the scale of entire continents to the smallest microhabitat, like a water filled tree hole or moss patch. In biodiversity science, we look to understand how biodiversity, whether of microbes or mammals, is changing at these different scales.
Put simply, diversity refers to how many different types of organisms we find. For example, starting at the most fundamental source of variation, genetic diversity refers to number of different versions (sequences) of a specific gene found in a species. If you collected twenty individuals of a single beetle species from a field and sampled each beetle for their genetic material (DNA), you would find differences in their genetic composition. This would give you an idea of the diversity within this population of beetles.
Studying the genetic diversity of populations help us estimate extinction risk. Typically, high genetic diversity is a good thing as it means populations are better able to adapt to habitat changes, mutations, or diseases. Studying genetic diversity change over time helps us to determine the prospects of a species. The black rhinoceros, for example, is listed as critically endangered partly because it has such low genetic diversity. Similarly, as we keep selecting the same types of rice/wheat/corn that grow best and fastest, we increase the risk of losing entire harvests to a single disease. On the other hand, populations can undergo a phenomenon known as evolutionary rescue, whereby their genetic diversity allows a population to adapt and recover to high abundance before it goes extinct. This is a topic the Gonzalez lab has contributed to and we identified the conditions leading to high probability of evolutionary rescue.
Now let’s count some bugs
One of the simplest ways of measuring biodiversity change is by tracking variation in species richness. Species richness is quite simply the total number of different species that live in a given area.
One way to measure species richness, which you may remember from biology classes in school, is to use transects and quadrats (see photo below) to guide where we observe and sample species. Transects are lines on the ground to follow and quadrats are ‘checkerboards’ that show where to count individuals of different species. Let’s imagine you are interested in the richness of insects in a field. You might lay out parallel transects along the field and then decide to put down ten quadrats along each transect. Then all you need to do is look within each quadrat and count the number of different insect species you find.

London Wildlife Trust ecologist Tony Wileman and assistant carrying out a transect survey of anthill meadow in Gunnersbury Triangle local nature reserve. The quadrats are placed every 2 meters along the transect line and all the plants in the sample area are listed.
With enough quadrats, you can estimate how many species—common and rare—are present in the entire field: this is species richness! The total number of different insects in your field is rarely known so we have to use statistics to reliably estimate species richness from just a sample of insects obtained from part of the entire habitat. There are many more elaborate ways to calculate species richness in an area, from satellite imagery to chemical samples and recordings of sounds emitted by animals but estimating how many different species are found in an area is the essential first step in studying biodiversity.
It also depends on abundance
Although species richness is an intuitive measure of biodiversity, it doesn’t take into account the abundance of different species. Another important way to measure biodiversity is to think about how many different common and rare species there are. Most ecological communities have a few abundant species and many rare species. Communities that have this pattern of species abundance are said to have low evenness. Evenness is a concept that helps us understand the diversity of a community and may reveal clues about the interactions among species.
Let’s think back to the insects in our quadrats for a minute. Let’s assume that we did our transect-quadrat survey in two different fields. In both fields, we counted on average four different species per quadrat. However, the first field had 10 individuals of each species and the second had 20 individuals of one species, 10 of another, and 5 each for the last two species (see figure below). Field one has a more even composition of species (25%-25%-25%-25%) than field two (50%-25%-12.5%-12.5%). In other words, field one has higher species evenness and higher diversity. When scientists measure biodiversity at a site we call it alpha diversity; the mean species diversity across sites. If two sites have the same number of species but one of them has a more even mix, then that site will have a higher alpha diversity. Comparing the alpha diversity of different sites is a way to assess the impact of human perturbations on biodiversity. Tracking the change in alpha diversity over time in a single location allows us to understand how the diversity of a site is changing. For example, whether sites differ in the diversity of invasive species, or if rare species are going extinct because of the application of a pesticide. Here again, making fair comparisons among sites requires that we be careful in our estimation of alpha diversity from sub samples of the flora and fauna found in sites over time.

Site 1 and site 2 have the same species richness as they both have 3 beetle species (blue, red and gold). However, site 1 has lower alpha diversity as there is only one red beetle there and if it were to be eaten, the species would go extinct.
And some sites are unique
However, understanding patterns of biodiversity change at large geographic scales requires additional measures. We also need to understand how biodiversity varies from site to site and region to region. This variation arises because species colonize and disappear from sites at different rates. Some species are present everywhere, while others are rare and appear only in a few sites. Spatial variation in species among sites is an important dimension of biodiversity. If each site contains distinct species, then summing species across sites will lead to many more species at the regional scale. By changing how land is used (e.g., intensive agriculture), humans can cause sites to become very similar in their species over large geographic areas. This homogenizing effect is common and is a significant cause of biodiversity loss.
For an example, let’s go back to our insects and imagine that we sampled four fields now in two different landscapes. All four fields contain three species. Fields one and two contain the exact same species (grasshoppers, giant beetles and earth worms). Field three contains pygmy beetles, jumping spiders and crickets. Field four contains ants, caterpillars and stink bugs. Fields one and two are identical whilst fields three and four are completely different (see figure below). With this information we can calculate beta diversity, a measure of how many distinct communities of species there are. In this case, sites 1 and 2 are equivalent, whilst sites 3 and 4 are different and contribute to beta diversity. Therefore, the second landscape with the unique sites has higher beta diversity.

All sites contain the same number of different species but if you compare them, sites 1 and 2 have the exact same species in them whilst sites 3 and 4 are both unique, meaning that landscape two is more diverse than landscape 1.
The final measure of biodiversity is one that helps us understand overall species diversity across an entire region. Gamma diversity combines the diversity of species within a habitat (alpha) with the diversity of species between habitats (beta). We use gamma diversity to compare the diversity of a range of habitats and communities within a region or across continents. This measure gives us an idea of how entire biomes made of different groups of species are changing. For example, there is evidence to support a decrease in gamma diversity in insects. It is a systematic decline in gamma diversity which is raising concerns about the beginning of a 6thmass extinction.
Mapping biodiversity change
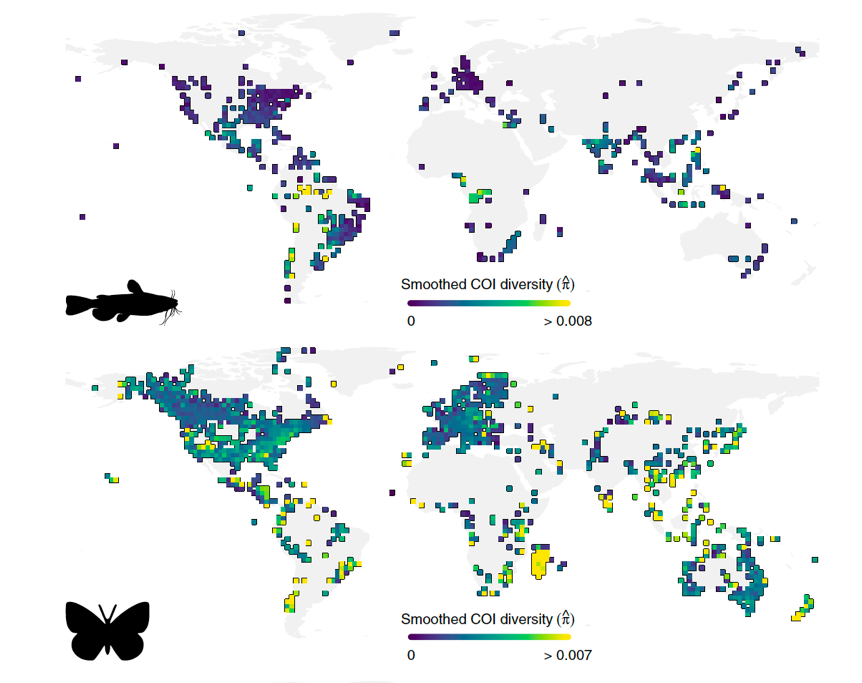
Spatial variation in genetic (COI nucleotide) diversity across many genetic sequences for inland and coastal bony fishes (20,388 sequences) and insects (130,433 sequences). This analysis is possible because of the thousands of genetic sequences that are available in large open data repositories such as ‘GenBank’ and from the ‘Barcode of Life Data Systems’ (BOLD). Figure from Millette et al. (2019) Ecology Letters
The research community has begun to work together to map where biodiversity is changing. The idea is to show which regions are experience rapid decline and which regions may be recovering or showing no change. These maps provide a biogeography of biodiversity change. The map below is taken from a study of change in genetic diversity worldwide led by Katie Millette. The maps show areas where genetic diversity is high and other regions where it is low. Other maps that show patterns of change for species richness and composition are also available. Together they are useful guides for conservation and efforts to reduce the strength of human causes (also known as drivers) of biodiversity loss.
So, what do we do in the lab?
In the Gonzalez lab, we are all working on biodiversity change in one way or another. As you can see from this summary of the list of ways in which we can measure biodiversity, this is a broad and active topic.
Lab postdoc, Chuliang Song, is focused on developing the maths and analyses used to quantify biodiversity. He is working on a new way of estimating diversity that would improve our understanding of differences in diversity among locations. This measure of beta diversity will help identify where to focus conservation efforts to protect the distinctiveness of sites over geographic scales.
To monitor biodiversity, I will use methods similar to the transects and quadrats of our example experiment but using much more modern technology. For example, by flying drones over coastal regions in British Columbia to take pictures of sea otters floating at the surface of the water and then using computer programmes to count each individual and estimate population sizes. Then, using models of sea otter diet, will calculate the species diversity of the invertebrate communities that live on the sea floor.
Images from satellites have become an important source of data for biodiversity scientists. Siddharta Khare and Juan Zuloaga are mapping the biodiversity of forests by combining permanent plots and satellite images to calculate how the diversity of forests in Quebec is changing through time.
Finally, as part of an effort to study biodiversity worldwide, lab members have been collaborating with the global network GEO BON (the Group on Earth Observation Biodiversity Observation Network), to develop a set of tools to guide scientists where to go to collect biodiversity data in order to improve our understanding of how it is changing now and predict how it will change in the future. Biodiversity monitoring is a vital part of understanding which human pressures (e.g. habitat loss and fragmentation, pollution, and harvesting) are driving biodiversity change and how great the impact is. With this information we can prioritize conservation action.
To wrap-up
Biodiversity exists at all levels of biological organization (genes, species and populations but also local, regional and global scales). Understanding how it is changing and at what spatial and temporal scales is an ongoing research challenge. The science dedicated to measuring this change, whilst it started many decades ago, has been expanding and developing as our knowledge of the natural world expands. A combination of on-the-ground fieldwork, new analytical methods and precise yet user-friendly computational tools allow researchers in the Gonzalez lab to contribute to this understanding. If you want to learn more about this exciting topic as well as many other biodiversity related questions, make sure to sign up to our quarterly newsletter and follow Andy on Twitter and if you have any questions about this topic, do not hesitate to leave a comment below!